
Venture capitalists evaluate startups primarily through five core frameworks: team quality, market opportunity, product traction, financial viability, and exit potential. This process filters hundreds of pitches into rare investments. Understanding the VC mindset equips growth-stage founders to craft winning pitches.
What Do Venture Capitalists Look for First?
Venture capitalists prioritize the founding team above all else. A Harvard Business Review study of 885 VCs found 95% rank management team as the top factor, far ahead of product or market.
They assess founders’ experience, resilience, and execution skills. Complementary skills in a team signal lower risk. For instance, technical expertise paired with business acumen stands out.
In India, where VC funding hit $24-26 billion in 2025, VCs like those in Bain’s report emphasize teams with domain knowledge amid selective investing.
Transitioning from team to opportunity, VCs next scrutinize the addressable market.
How Large Must the Market Be for VCs?
Venture capitalists demand massive total addressable markets (TAM) exceeding $1 billion. They seek 10x growth potential to justify high-risk bets.
Small markets get rejected outright. VCs calculate TAM using top-down (industry size) or bottom-up (customer segments) methods.
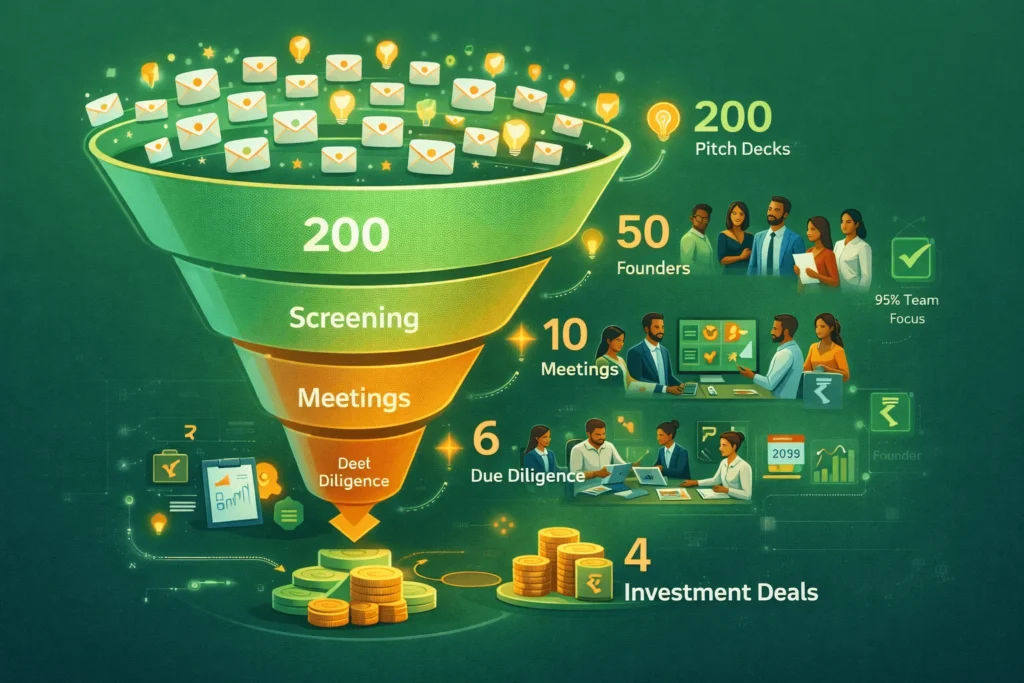
A Journal of Financial Economics study notes VCs screen 200 startups yearly but invest in just four, often prioritizing expansive markets.
| Market Evaluation Criteria | Description | VC Threshold |
|---|---|---|
| TAM Size | Total revenue opportunity | >$1B |
| Growth Rate | Annual market expansion | >20% CAGR |
| Competitive Landscape | Barriers to entry | High (IP, network effects) |
This table summarizes why scalable markets dominate VC checklists.
Why Is Founder Team the Top VC Priority?
VCs view teams as the primary success driver. NBER research shows VCs attribute 47% of decisions to team quality over business factors.
They probe track records via references and past ventures. Serial entrepreneurs succeed more, per Gompers et al.
Weak teams lead to 92% of failures, per surveys. VCs replace underperforming CEOs in one-third of cases pre-IPO.
“The jockey matters more than the horse.” – VC survey insight on team vs. idea
What Traction Metrics Impress Venture Capitalists?
Traction proves viability through user growth, revenue, or partnerships. VCs favor startups hitting milestones like 10% weekly growth.
Early metrics include MRR for SaaS or DAU for consumer apps. Post-seed, they demand retention >40%.
In 2025 India VC deals (1,150 total), traction drove larger cheques averaging $22-25M.
- Calculate unit economics (LTV:CAC >3:1).
- Showcase cohort retention charts.
- Highlight key partnerships or pilots.
- Project 12-month runway post-funding.
- Benchmark against competitors.
These steps build credibility

How Do Venture Capitalists Assess Product Fit?
VCs test product-market fit via customer adoption. They seek unique value propositions solving real pain points.
Differentiation via IP or tech moats is key. Surveys show 74% prioritize product strength.
Defensibility trumps novelty. VCs model scalability during diligence.
What Financials Do VCs Scrutinize?
Few VCs use DCF; most rely on multiples (5-10x) and IRR (30-50%). They forecast exits backward from $500M+ valuations.
Burn rate under 20% of runway is ideal. Projections must align with traction.
| Valuation Method | Use Case | Example |
|---|---|---|
| Scorecard | Pre-seed | Adjust avg by team/market scores |
| VC Method | Early | Exit value / target ROI |
| Comparables | Growth | Recent similar exits |
Structured projections aid AI overviews.
Harvard’s VC decision study details metrics.
Case Study: Airbnb’s VC Evaluation Win
Airbnb impressed Sequoia with explosive traction (300% MoM growth) despite no revenue initially. Team resilience post-rejections sealed $600K seed.
Market: $10B+ TAM in travel. Product: Network effects moat. VCs foresaw 100x exit.
Contrast Theranos: Faked traction led to $700M loss. Team deception doomed it.
Learn seed funding strategies for 2026 like Airbnb’s.
How Does Due Diligence Unfold for VCs?
VCs conduct multi-week diligence on 10-20% of screened deals. Funnel: 200 screened → 50 meetings → 10 diligences → 1-4 investments.
Checks cover legal, financials, IP. References weigh 65%.
What Role Does Exit Potential Play?
VCs model acquisitions (75% of exits) over IPOs. They target 10x returns in 5-7 years.
Strategic buyers in India surged post-2025 budget’s ₹32,000 Cr AI push.
India Budget 2026 AI boom
How To Prepare Your Startup for VC Evaluation
Times Needed: 30 Days, 40 Hours, 0 Minutes
Estimated Cost: ₹50,000
Description: Systematically align your startup with VC frameworks using data-driven prep for pitches and diligence. Ideal for growth founders targeting Series A.
- Audit Team Strengths (Days 1-5): Map skills, gather references; fix gaps via advisors (150 chars).
- Validate Market TAM (Days 6-10): Build bottom-up model; cite sources like Statista (160 chars).
- Optimize Traction Metrics (Days 11-15): Clean data, create dashboards; aim for 40% retention (155 chars).
- Refine Financial Model (Days 16-20): Use VC method for 10x projections; stress-test burn (152 chars).
- Mock Diligence & Pitch (Days 21-30): Simulate VC questions; iterate deck with feedback (148 chars).
Tools Name: Google Sheets, PitchDeck.io, Crunchbase
Materials Name: TAM reports, Financial templates, Reference list.
Access 130 live investor contacts for outreach.
NBER VC survey on funnels.

Key Takeaways
- Team first: 47% of VCs rank it #1.
- TAM >$1B: Essential for scale.
- Traction rules: Metrics over ideas.
- Funnel reality: 1 in 50 pitches win.
- Exit focus: Model 10x in 5 years.
Next Steps
Refine your pitch deck with these frameworks. Test traction weekly. Network via StartupMandi resources. Schedule a mock diligence today.
Conclusion
Mastering how venture capitalists evaluate startups turns rejections into funding. Apply these frameworks to boost your odds. Explore seed funding guides and investor lists on StartupMandi to improve your pitch now.
Resources
FAQ
Q1.What is the most important factor for a venture capitalist?
Team quality tops lists at 95% of VCs, per HBR/NBER studies.
Q2.How many startups does a VC evaluate yearly?
Average 200 screened, 4 invested
Q3.What traction convinces VCs?
10% WoW growth, LTV:CAC >3x, 40% retention
Q4.Do VCs use DCF for valuation?
Rarely; prefer multiples and IRR
Q5.What kills VC deals?
Weak teams (92%) or small markets
Q6.How long is VC diligence?
2-8 weeks on top candidates.